Scoring a Franchise System Based on a 300+ page Legal Document (FDD)
A technical case study into LLM extraction, Eval Sets, and Production Scoring of Franchise Systems using AI.

This is a technical article (human written) about scoring a franchise system based on the contents of a Franchise Disclosure Document (FDD).
For a business overview of what an FDD is, or the broader domain problem to solve, this article goes into greater detail.
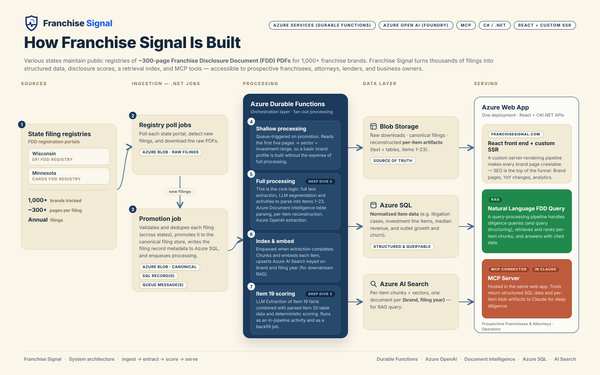
This franchise scoring system is also downstream of many complex technical processes that run to ingest, extract, and structure the content of a 300+ page FDD PDF explained in the aforementioned article.
This brief YouTube short video serves as intro context into the article.
What Are We Measuring with a Franchise Disclosure Score?
"Scoring" is a broad term... compared to what? What does "good" mean? It can get quite philosophical when trying to recurse to a base case and figure out how to judge something.
Your business may involve underwriting, lending, risk analysis, or comparing multiple decisions. Any score is only as meaningful as the data that goes into it, and a clear relationship between the score and the ultimate outcome.
In the franchise world - with thousands of brands spanning quick serve restaurants, fitness concepts, or home services - the only real thing tying all of these together under one umbrella is the business model and legal relationship between franchisor and franchisee.
So any score created that tries to "judge" a bakery vs a gym vs a plumbing business is inherently limited.
As a result, I decided on something that takes into account the following:
- Consistent application and meaning across brands and sectors
- Gives insight into how a score evolves over time for the same brand
- Takes into account broader system growth and churn (and what could be considered "too fast" on either end)
- Can be reproduced and verified by anyone with the FDD
This last one (#4) is critical for setting expectations and verification from a technical perspective (as we review below).
The Scoring Formula ("Simple?" Arithmetic)
The scoring rubric I landed on is a "simple measure":
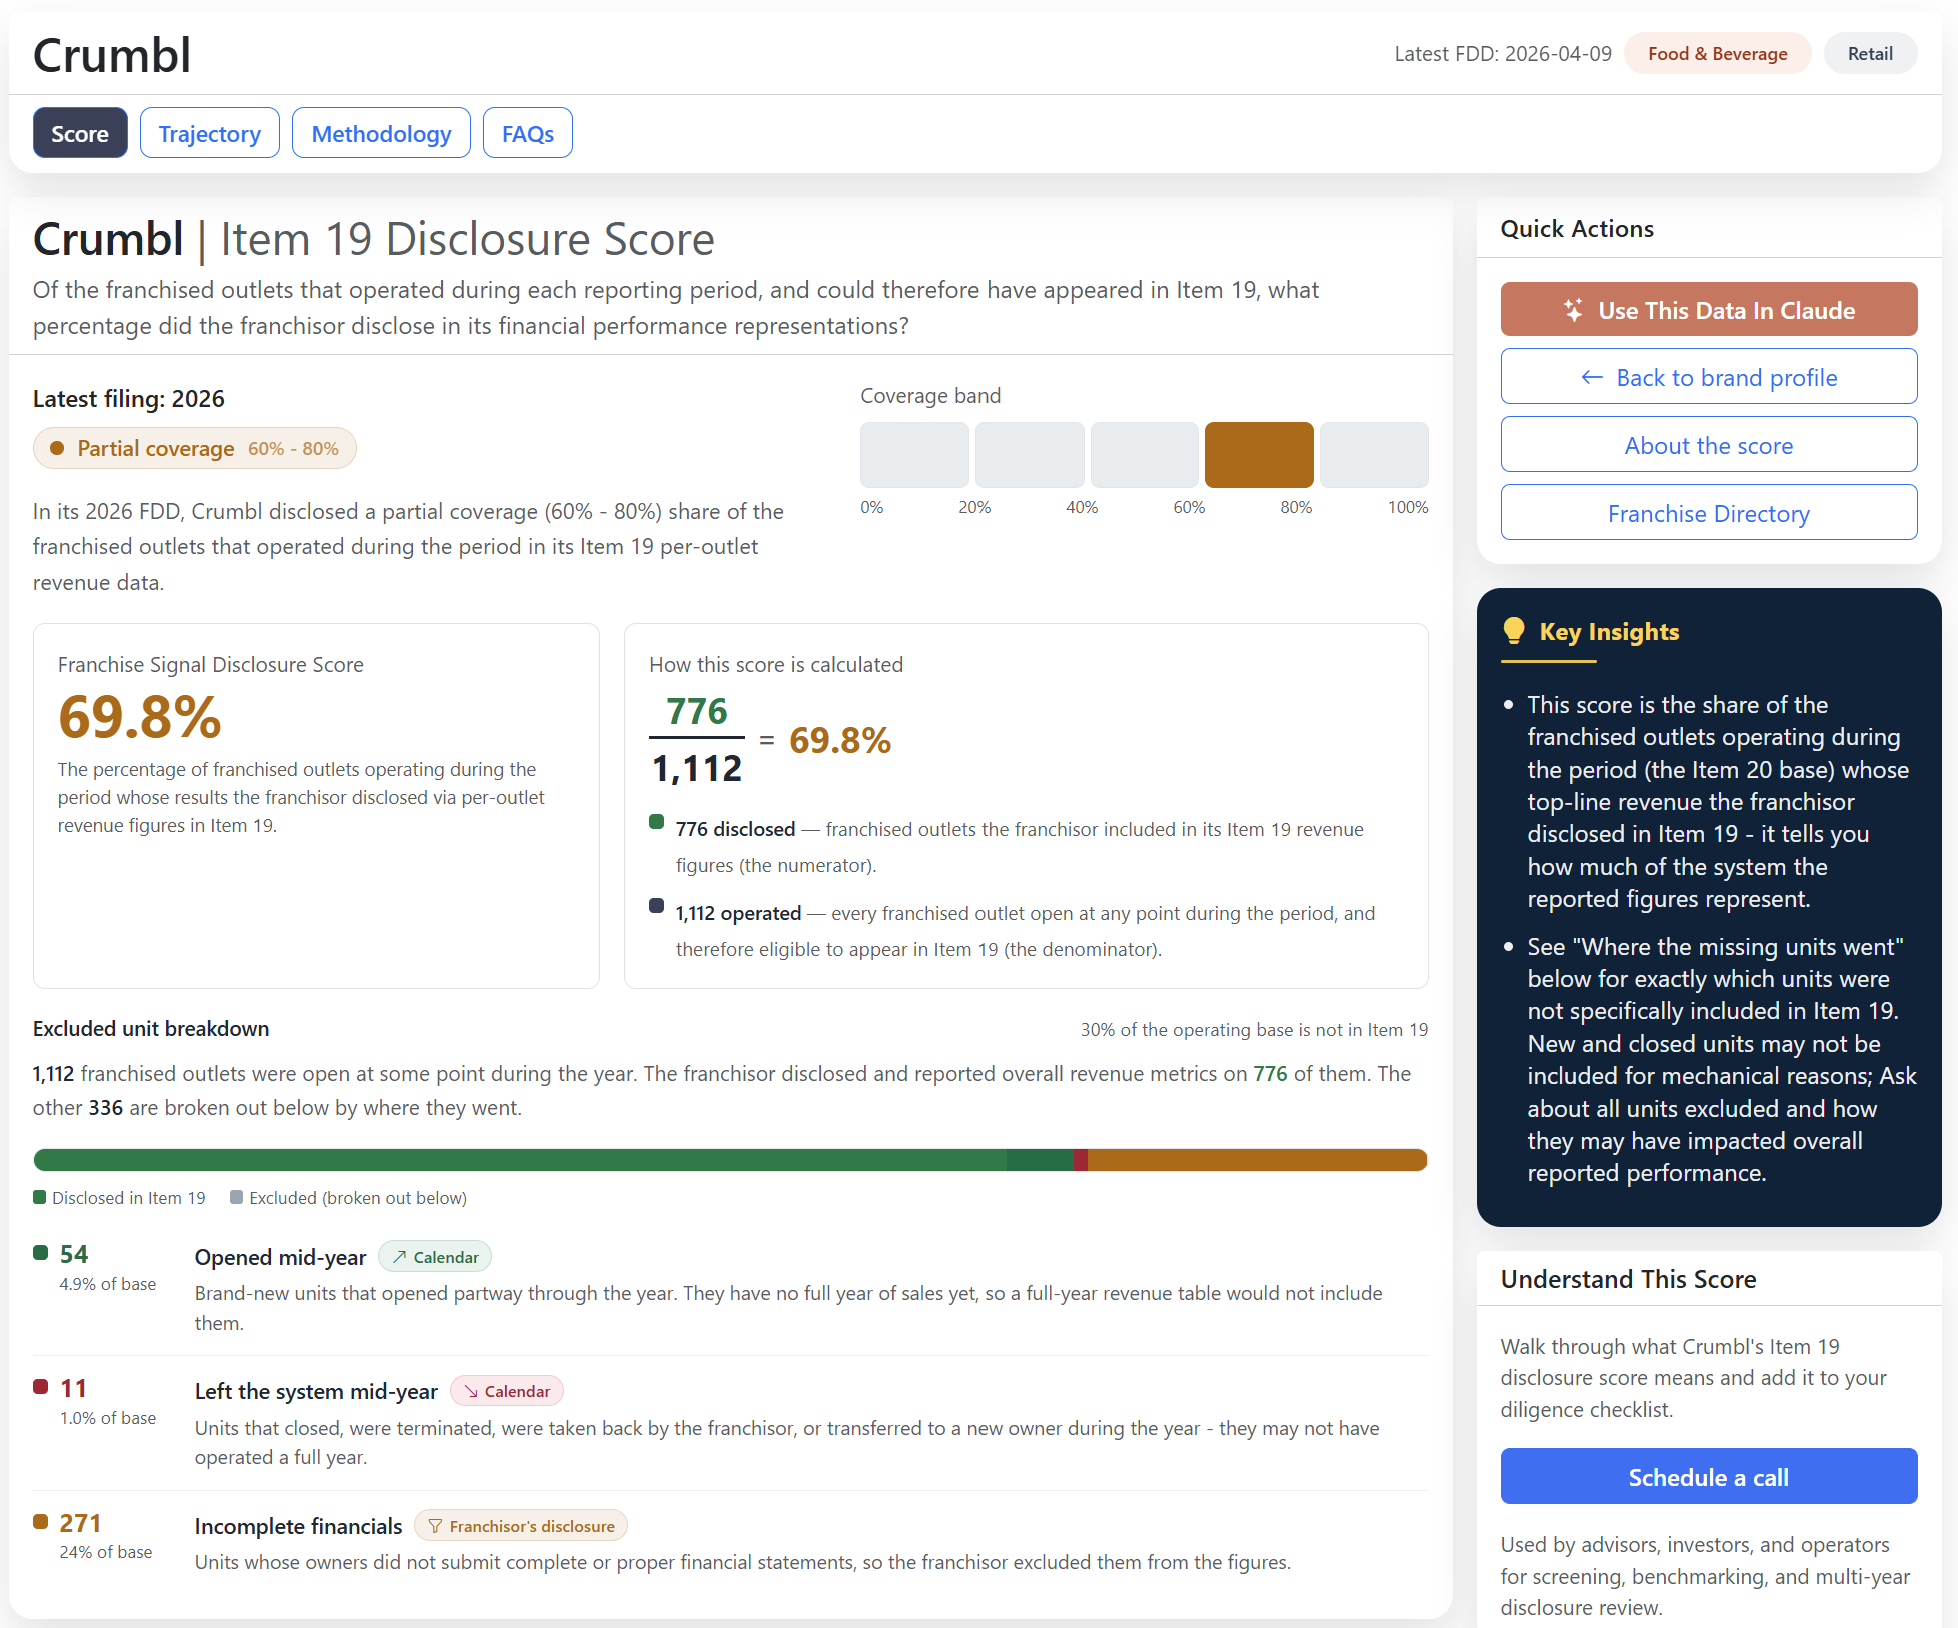
Of all of the franchised outlets that operated at any point during a brand's filing year, how many were included in a revenue per outlet measure (median and/or average) in a brand's Item 19 financial performance representations?

Extracting the Denominator (the "Easy" Part)
Franchisors are required to disclose Item 20 in their FDD. This section has standardized reporting requirements for number of franchised units, growth, termination, and closures within a system.
As such, we extract this data and the denominator is a simple SQL query (thanks to all of the heavy lifting upstream of ingestion, parsing, data modeling, extraction, and normalization upstream).
We run a SQL query to get the required data from Item 20 of the FDD and add (franchised units at start of period + franchised units added during period). This serves as the base of outlets that had some level of operation during the year.
Of these units, we also run SQL to pull terminations, ceased units, and non-renewals - while already included in the above base - this lets us add specific context in scoring notes as to why a franchisor may have left out units.
Per-item artifacts
The Item 19 and Item 20 artifacts (text + tables) are produced by upstream processing and extraction.
Item 20 denominator
Item 20 Table 3 from the FDD supplies the outlet counts — start, opened, terminated, ceased, end. This is extracted and persisted upstream of scoring/extraction and as such the Scoring LLM already has the denominator.
Two entry points
LLM Extraction
Reads the Item 19 + Item 20 artifacts and emits defined schema disclosure facts with evidence (populations, ownership, metrics, reporting periods, grain). It only extracts numerator populations among charts, tables, text, and footnotes.
It does not perform scoring.
Deterministic Scorer
FranchiseScoring.Core reconciles the disclosed numerator against the Item 20 denominator: coverage % = included ÷ operated-during-period, and an exclusion breakdown that sums to the gap.
Persisted per-brand-filing Disclosure Score
Score document (classification, %, exclusion breakdown, confidence, review notes) plus a run artifact holding both stages’ full JSON. Full scores are gated for paying customers, ranges are displayed in the UI for anonymous visitors.
Score Result Classifications
Review Queue
All scores stored as JSON and in SQL for queries and highlighting any low confidence scores for manual review.
Guardrails
Extracting the Numerator (much more complex)
This seems like it would be easy...
Surely a brand has a table of anonymized revenue by outlet? They do charge royalties to every franchisee outlet based on percentage of revenue...
The fact that this is not the standard is exactly why I created this score.
And also where the technical complexity comes into play.
Item 19 of an FDD is where a franchisor discloses financial performance representations. Note that disclosing anything is optional here. Disclosure in many cases is balancing and framing the minimum and best results of franchisees (so that prospective franchisees and brokers have something to rely on) versus any full disclosure that could be seen as or imply unfavorable performance.
As a result of this framing variability (versus strict SEC type requirements), there are dozens of edge cases to consider (which is a challenge for a prospective franchisee to consider and also for technical extraction)...
- Franchisors can have dozens of tables with varying population (franchisee) subsets. Footnotes and table formats vary significantly as does the overlap of tables.
- There are often non-revenue metrics such as average quote, job size, or COGS data.
- Franchisors report on thirds, quartiles, or quintiles of varying cohorts.
- Franchisors will report based on aggregated franchisee revenue across multiple territories.
- Early stage franchisors often completely ignore any franchise locations and put affiliate details in place of franchisee metrics.
- Locations that have not been open for a full year or closed or were transferred during the year are commonly excluded.
It took dozens of scoring runs to iterate through and form eval sets for all of the edge cases (covered below).
Extraction and Scoring Mechanics
From a technical perspective, scoring is a C# class library (FranchiseScoring.Core). It gets invoked as an activity in a full brand process (Azure durable function upstream) or as part of a .NET scoring run job - which iterates through any number of brands to process the score by filing year.
First is extraction. We have a defined schema, system, and user prompt (which took many iterations to tune). The system prompt alone is ~6.5k tokens. And the user prompt includes all raw text and tables (as JSON) pulled from item 19 (extracted upstream as outlined here).
The prompt versioning (schema, user, system) lives in source control and is loaded from Azure blob at run time. The call is made to Azure OpenAI via the specific Azure foundry model deployment.
The LLM is only responsible for extraction. The extraction result includes an array of every population seen in Item 19 and buckets it into a treatment type (ie per outlet revenue, affiliate, contained in a broader population, etc).
We save the extraction population JSON and then run a specific scoring algorithm - which is pure C# with no additional LLM calls. Scoring generates the final score payload and the notes - which define "which and why" certain populations may have been excluded from the score.
Scores and metadata are persisted into Azure SQL so that we can run reporting and aggregation across all brands scored.
How Do We Know The Score Is Correct? Setting Up Eval Fixtures
Getting the extraction prompt to account for all of the edge cases and scenarios seen across hundreds of brands and item 19's takes dozens of iterations.
Each new edge case gets added into the test library as an eval. We manually build and use AI separately with the original source FDD to build extraction payloads and "golden" scores. We have about 20 different brand-year extraction and score payloads saved in a test suite.
As a result, with every new LLM prompt update seen, we can re-run the test suite and get quick green tests and verification that each run performs as expected.
This is the hard, manual, and time-consuming part. Especially with something like FDDs, where there is so much variability in presentation of Item 19, we can always add more evals for greater coverage.
If you are still reading this far - please ping me on this part. I have much more to talk through on this subject.
Edge Cases, Guard Rails, and Testing
As outlined above, getting a prompt, schema, and eval set all working together is the real legwork here. We have a suite of tests:
Regression Tests: we run a full 20 brand years against our DB, Blob Storage, and send to the LLM (Azure OpenAI). We persist the score payloads in a local file system. The test suite picks up the latest score payloads and verifies against our saved eval "golden" scenarios.
Scoring Tests: we run fixed extraction payloads through the scoring algorithm to ensure that the scoring rules all check out.
Running in production we also have a number of guard-rails, checks, and human-in-the-loop processes and an admin control plane behind the scenes. We display a confidence output to users which is important for reducing data liability on anything requested in real-time from a user. And also for identifying additional edge cases that may need to be "looped" back through the above process (updating enum classifications, prompt updates, etc).
We have a low/medium/high confidence output by the LLM for certain rules (ie if multiple geographies are mentioned, or if specific types of edge cases are seen). We also run checks to see if a score is above or below specific thresholds (ie > 100%).
Beyond ~100 brands, cost becomes a constraint. Between Azure Document Intelligence API calls, extraction, persistence, and scoring LLM calls - we cannot naively process 2,000 brands across multiple years all at once without incurring expense. Having a test suite, guardrails, and surfacing some of these details to users passes on data liability and processing flexibility.
Next Steps
We talked earlier about broad "scoring" adjacent business functions for underwriting, investment analysis, and decision criteria. And in this article, we highlighted the importance of eval sets and clear business logic to act as a driver for any AI.
Also assumed, but not talked about explicitly, is how important the underlying data and structure is before layering on any type of AI. No AI extraction or scoring works without having the earlier foundations to build upon, and technical debt must be solved before exploding complexity (and blowing up unneeded token cost).
The technical complexity and domain specific problems to solve with AI and data infrastructure are endless as this technology continues to evolve. I am currently exploring sales engineering and forward-deployed engineering roles. If you have AI and data initiatives in flight at your organization, I would welcome a chance to connect.